Instrumentation in Azure
Nowadays app instrumentation is very important. It helps to monitor how our infrastrucutre and application works, allows to detect weird behaviors and security issues. Thanks to logs we can easly find out why bug occured in application and fix it quickly. Instrumentation also provides us with valuable information on how users use our app. On the market, there are many providers of logging and monitoring solutions. I would like to describe it a bit how we can monitor in Azure.
Logging to file system or blob storage
Azure allows administrator to setup basic logging to the file system. This kind of logging is not the best way to do it but can be used for some quick developer checks. This is disabled after 12 hours by default because it can exceed storage quickly. There is also another drawback of this kind of logging. If you use it together with scaling it is really difficult to collect logs from different instances and find what you need.
How to turn on?
- Go to App Service logs tab in App Service menu.
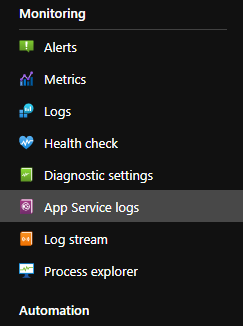
- Turn on Application Logging (Filesystem or Blob).
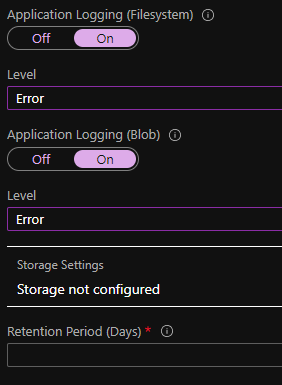
Here you select severity level and for blob logging: storage account and retention period.
Downloading logs
If using Kudu you should go and find folder D:\Home\LogFiles. There are the logs for Windows-based apps stored by default. In case of hosting apps on Linux-based app services they can be found in STDERR and STDOUT.
There is also easy way to download logs with Azure CLI by executing following command:
az webapp log download --log-files \name.zip --resource-group $resourceGroup --name $applicationName
Blob
As mentioned aboce, there is possibility to save logs in blob storage. However, that works only for Windows-based web apps. If it is turned on logs are saved in folders with following structure: year\month\day\hour.
App Center for Mobile and Desktop
All above is about how to save logs for web apps. But what if you develop desktop or mobile app? Here App Center comes to the rescue. It is a great platform for monitoring and managing your application. It can easly integrate with Google Play Store or Apple Store. App Center not only lets you monitor but also build and distribute your software to end-users.
To start using it you need to install AppCenter SDK in your app and thats it. App Center allows you to configure itself to let users choose if they want or not to send you diagnostic data.
Logs rentention
All logs are store by default for 90 days but can be shorten to 28. If you want to extend that period you might export data to Azure Blob Storage.
Copy of data collected by App Center can be sent to Application Insights for further analysis.
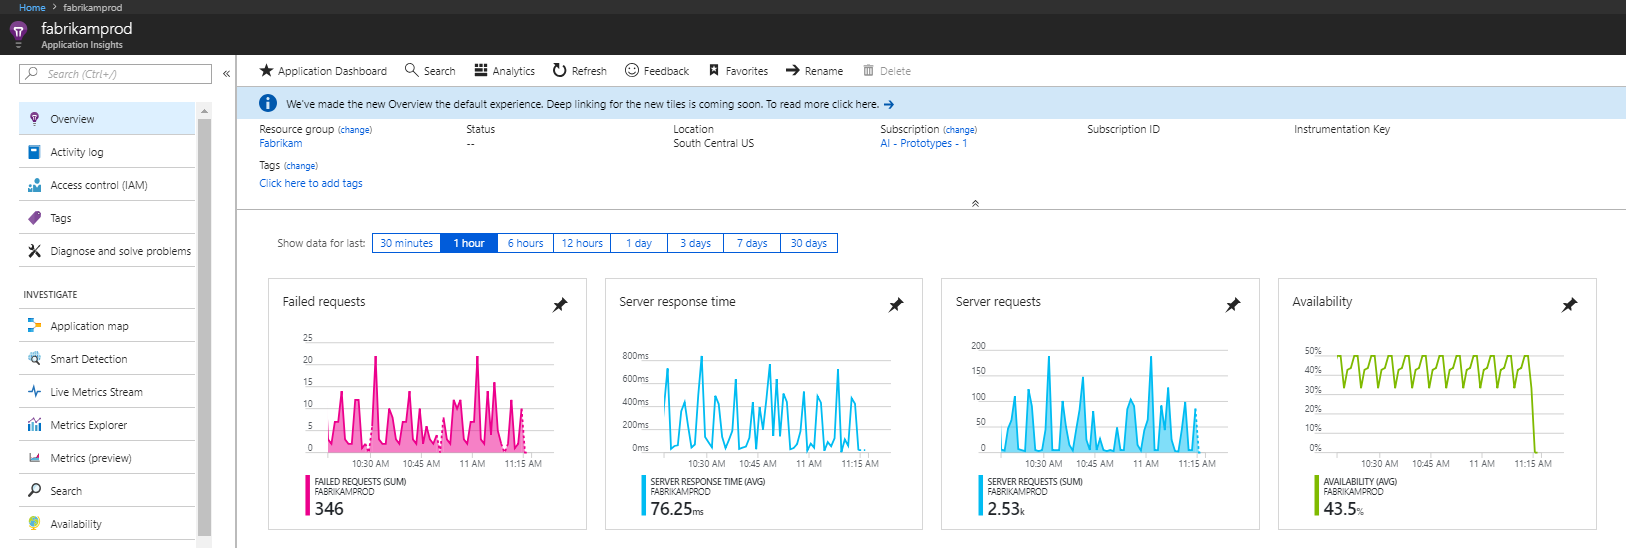
Application Insights
Application Insights - as part of Azure Monitor, it is most complex solution for application performance management in Azure. Service automatically detects anomalies and contains many powerful analytics tools. It can visualise telemetry in variety of ways:
- live metrics streams - almost real time performance values,
- metrics explorer - tool that shows how metrics vary over time,
- alerts - sends to applicaiton administrator a message when specified metric exceed assumed threshold,
- profiler - shows how a set of requests are delivered,
- application map - displays components of app and how they are linked to each other,
- usage analysis - info about user using your app
Application Insights use language called KUSTO to query logs.
Backend
There are two ways to enable instrumentation in your app:
Runtime
You can do it without any changes in your code. This can be done by enabling only checkbox in service you use. Turn on it by going to App Service -> Settings tab -> Application Insights and select Enable option.
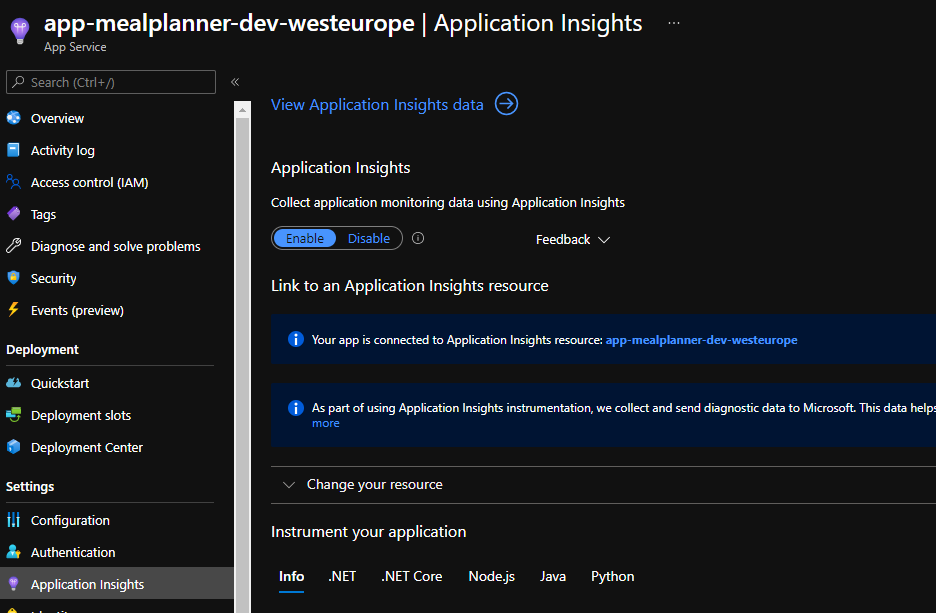
It is easy and fast but has some limitations. Firstly, it works only on Windows-based app services. Secondly, it collets more basic data and it is lack of all great logging features available with SDK.
Build-time
This means you have to install SDK to your application. There are many supported languages and frameworks like .NET, Java, Node.js, Python and probably many other created by community, This way you are provided with feature-rich solution to monitor your application.
Frontend
There is also a way to enable client-side instrumentation by including javascript library in frontend web page. This can be done just by adding application setting called APPINSIGHTS_JAVASCRIPT_ENABLED with value 1.
Monitoring cloud resources
Azure Monitor is a great service of Azure. It is a heart of whole logging and monitoring of infrastructure. It provides single management point for all infrastructure logs.
Service collects data from all tiers:
- app monitoring - data about performance of the code
- Azure resources
- subscription - management and operations information
- tenant monitoring - for example monitoring of Active Directory
All the data from Monitor goes to Log Analytics where it is automaticaly indexed and datatypes and tables are created.
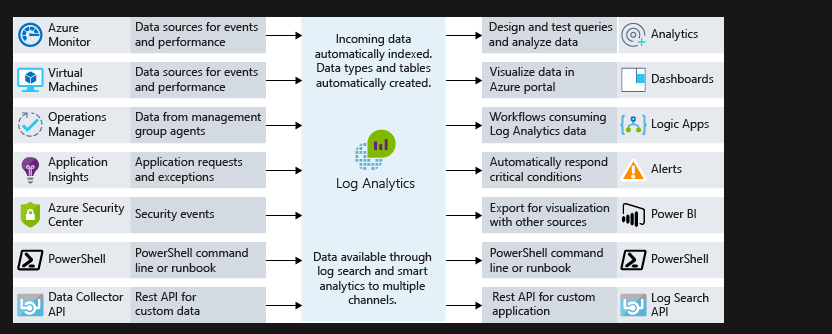
Log analytics
Log analytics store all data that can be later consumed by any service we can imagine. We can visualise data in Azure portal creating dashboards or export for visualization in services like Power BI.
But as you can se on picture above there are other options no less important. I would risk the thesis that even MORE important.
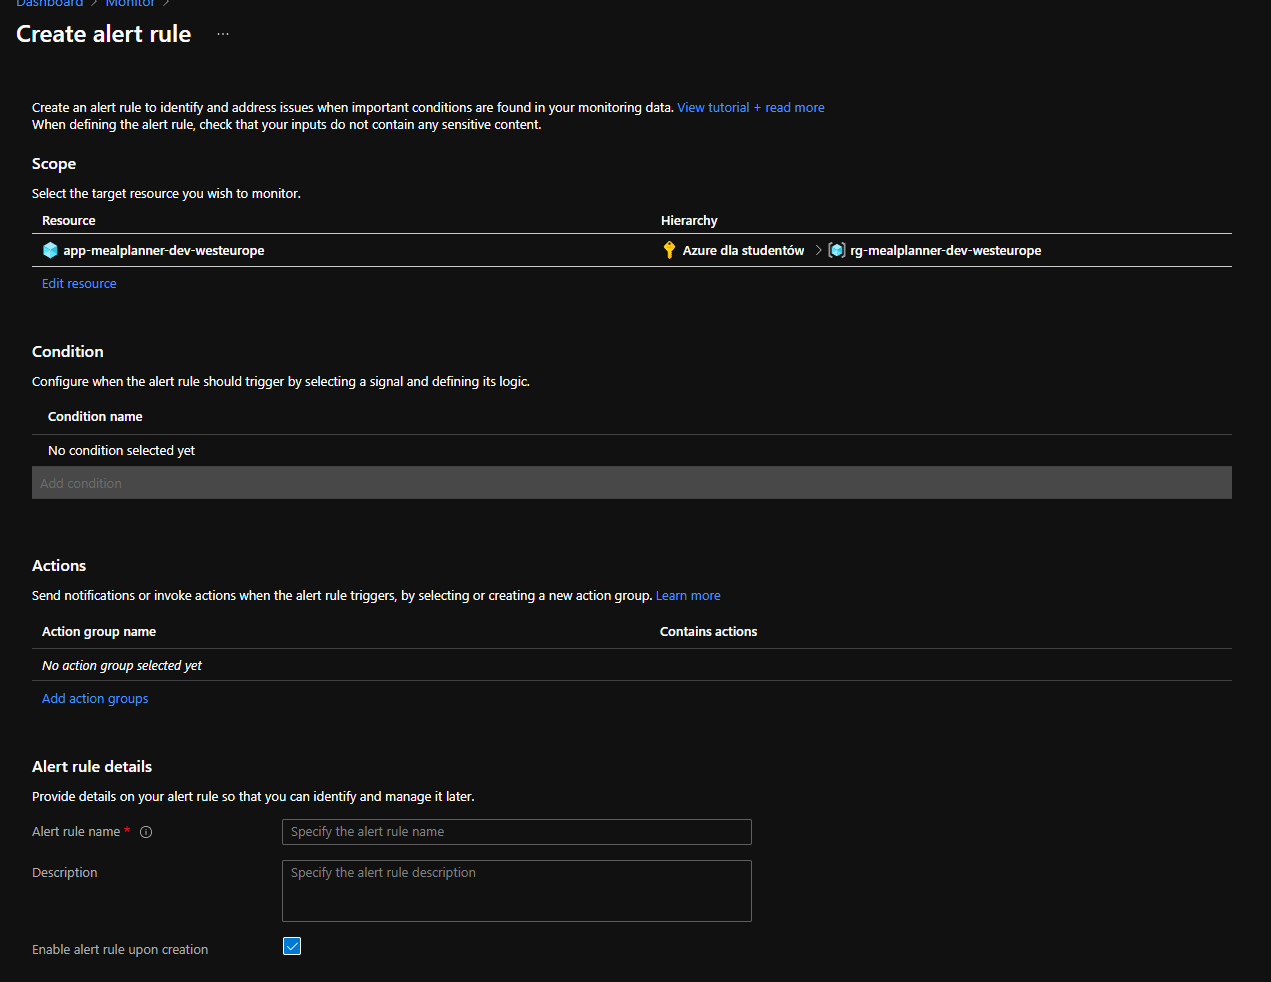
Alerts
You can define alerts. Alerts are used to notify specified person/people about exceeding threshold. In order to do that you should go to Monitor -> Alerts and create alert rule. Here you define resource, conditions and action that should be taken when conditions are met. One condition costs monthly around $0.10.
Logic Apps
Logic apps can be triggered whenever schedule is set. Then with Azure Monitor Logs connector it can run query and list results or visualize them. That is how it can send it to other external systems. Same functionality can be used by more business solution called - Power Automate.
Other
There can be also Powershell scripts that will run in response to alerts or Rest API endpoint that will be triggered.
Comments